Yesterday we went through the Fed’s Stress Test documents and created a toy model to see projected losses under some U3 numbers. I want to talk about a few observations from both the model and the Fed data itself.
A New Fed Stress Test
Elizabeth Warren is calling for a new round of stress tests. This seems like a political non-starter. Can our model make it more appealing?
Let’s say that U3 goes to 12.2% in the DIY Stress Test Model. The Financial Sector, which needed to raise $76bn under the adverse scenario, now needs to raise an additional $272bn. How is that distributed? Here’s a graph (Updated, and fixed):

Four firms – BoA, Citi, JP Morgan Chase and Wells Fargo – account for 75% of the new losses. Morgan Stanley is 5%. Everything else is less than 4%, with some still at zero.
I believe we should have another official Stress Test of the largest 5-8 firms at the end of the summer. There is no reason to drag in all the firms all over again. To whatever extent American Express and other small players had unknowns going into the crisis we have a handle that their capital reserves can take a shock and if they need to raise $1-$3bn the market should be able to handle it. If BoA needs another $75bn, that will have to come from the government.
We still have a lot of uncertainty with the largest 5 firms, and since we, regardless of how they are paying their TARP, have a liability in them we should demand accountability. In an additional 3 months it will be much clearer what both the books and the economic outlook will be. As a bonus we’ll have them already committed to a set of models and techniques. To whatever extent they could cherry-pick their data and their models the first time around, we can force them to stay consistent the second time around and extrapolate confidence intervals from there.
A “5 firm Stress Test Checkup” will also be as an easier sell. Instead of dragging what felt like the entire financial sector in front of the jury we look at the specific firms we know have a problem. That strikes me as fair and appropriate and also more politically reasonable.
What about Size versus Losses?
There was a bit of a blogosphere debate a few months ago about the optimal size of a bank. There was an argument from the big-is-better crowd that larger banks may have more losses net, but as a percent of total assets it will be smaller. A bank that is size $100 might lose $10 for a 10% loss, and a size $50 bank might lose $7 for a 14% loss. So even though the big banks were losing more total dollars – $10 versus $7 – they were probably doing better as a percent than the smaller banks – 10% versus 14% – because they were more ‘innovative.’
The argument was that larger banks would have smaller expected losses overall as a percent (or, alternatively, that smaller banks would have a larger expected loss percent) because there was some sort of return to risk management with size. Larger banks can hire the smartest MBAs with giant salaries to have them ‘innovate’ risk-management techniques that your local bank can’t afford. Your local bank can’t lend to CRE developments in Japan while handling credit cards in Hong Kong while also giving out subprime mortgages in the LA suburbs. Your Giant Bank can. By having access to more lines of business they would be able to diversify their lending in a way that takes advantage risk management techniques not available to smaller banks.
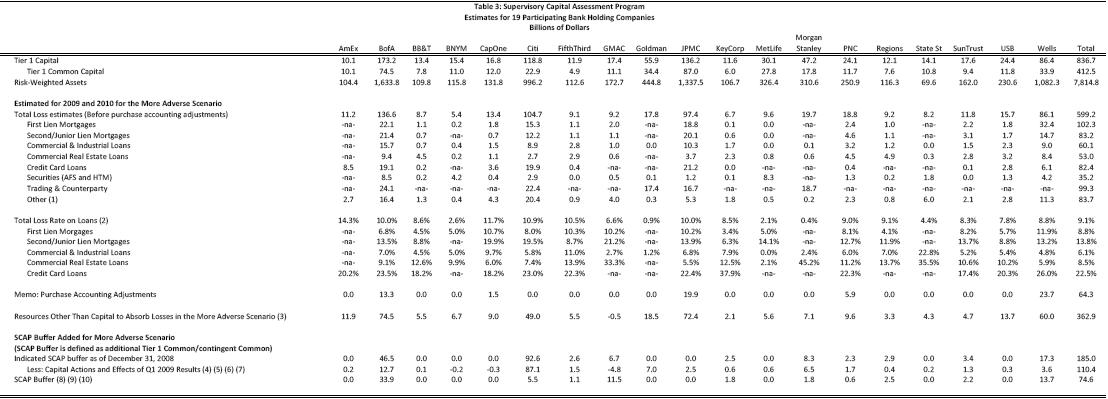
How’d that work out? I want to show you a really interesting chart. Let’s look at risk weighted-assets plotted against total losses for all the firms (kicking out American Express as a non-appropriate outlier). From the Fed’s SCAP Document, specifically the summary chart I put here, so no toy model:

This chart should feel like someone just kicked you in the stomach. The biggest banks, using their own models they chose to report to the Fed, did terrible compared to a basket of small banks.
At a base level, in a crisis all correlations go to 1. So whatever diversification benefits the largest banks had by being able to hold on to all asset types is out the window. To whatever extent their being big allowed them to have larger and smarter capital buffers, that is gone as well. Instead of being lower, or even random or having no pattern, it is clear that the bigger banks do worse with handling losses and risk than small banks do even as a percentage.
I really want to see this replicated large scale in a more controlled fashion, but intuitively this makes sense to me. The bigger you are the more internal noise there is in your corporation. It is easier to make a clever 10% return with $100m than with $1bn; alpha does not scale well, and the bigger you are the more competition is watching you. The obvious thing to do to get larger profits than your smaller competition is to keep a smaller capital buffer. There is a separate argument that bigger banks can handle larger losses better; beyond having a kind of financial nihilism to it, it has turned out to be completely untrue. So here we are. Looking at the data for a while, being big is a big liability. For those banks. But mostly for you, me and everybody else.


Rorty–Maybe I’m blind, but I don’t see JPM reflected in your pie chart. Anyway, the other three bad banks–BOA, WF, & Citi–account for about 3/4s of the potential shortfalls at higher U3.
Greatly appreciate all the work you’ve done in putting this spreadsheet analysis together. It is very helpful in understanding where we are and, worrisomely, where we might be headed.
I think your last graph does refute the idea that size brings safety, but it doesn’t well establish the opposite because the sample size of large banks is only 4. There was a wide range of performance among small banks, and it’s true that all 4 of those large banks were near the bad end of that range; but 4 is still only 4, so I don’t think the idea that they are systematically different from small banks is well established.
Or, in other words, calculate the p-value for your (implicit) claim that the mean percentage loss of big banks is different from the mean percentage loss of small banks; I predict you will find it is well below conventional standards for statistical significance.
Thanks Terry. I had uploaded an image that wasn’t correct – it had a few companies as one blob. Now it is accurate. So much data, published on the fly and on a blog, I’m trying not to make mistakes – I think this is the first one in this series 🙂
when people were going through the numbers the first time there was a speculation that at least in Citigroup’s case some of the off-balance assets were NOT included in risk weighted assets (because these were measured as of end of 2008) but that losses from these assets WERE included (because the plan is to bring them on-balance sheet by end of 2010). Do you know if this is the case?
If this is the case then your loss percentages might be overstated for at least Citi — your denominator might be off by a bit.
And another question about the numbers.
WFC bought Wachovia, BofA bought Merrill, and JPM took over WaMu.
Whether Wachovia / Merrill / WaMu wre insolvent or not, they all had huge losses.
So two questions:
— Do you know how these mergers affected the loss percentages?
— If there were a cap on bank size, how would you deal with the failure of mid-sized or large institutions? Typically the FDIC looks for another institution to take them over, but that would not be possible.
Chris, I’m on that. My suspicion is that it won’t clear, because there is too much noise in smaller bank (the std on the big banks is surprisingly low). It’s going to be the nature of consolidation and the current MBA wave for mergers and giganticness that there will only be a few at the top.
Q, first question: no idea. I purposely only used the Federal Reserve’s SCAP Summary Documentation without bringing in any other market information so that I knew all the weaknesses and strengths of the information at hand.
On a first approximation, given that I believe the political economy of these tests were less to be critical and more to be comforting and soothing, I’d be surprised if Citi purposely reported numbers that biased against them. The Fed, from what we understand and also implicit in their documents, gave a fair amount of leeway in how the numbers got reported.
I’m not sure how the second question matters one way or the other. As for the third, how are we dealing with them now? We currently don’t have an institution to take over any of the big four as it stands. I’d rather deal with a smaller zombie than a bigger zombie.
Pingback: Friday links: ETF excess Abnormal Returns
Thanks for your response.
I am not saying that Citi reported anything that was untrue or biased against them; I’m saying that the set of information reported in the SCAP did not answer all the questions one might answered, and I’m not sure the SCAP gave you the answer I think it gave you.
In any case it’s fair to say that during a crisis large institutions don’t necessarily fare all that well, and that it’s insane that we don’t have a protocol for recapitalizing or liquidating these institutions.
As for the ‘I’d rather deal with a smaller zombie than a bigger zombie,’ I’m not sure I agree with you. I’m not sure I disagree with you. The first order comparison in any case is N small zombies (or 80% of banks are zombies) rather than one large one. And not all crises are the same — offhand I would guess that smaller banks means more but less severe crises, but this is a “gaussian probability” statement and ignores the statement that during a crisis correlations go toward 1.
In fact, if you think that during a crisis, correlations go toward 1 then you would expect extremely high levels of failure independent of bank size, and so you would need a proscriptive protocol for dealing with extremely high levels of failure, which probably wouldn’t be easy.
I think that systemic risk is a fickle thing by nature (if you don’t have a crisis, you probably don’t know you were close to having one) and difficult to contain (it will move toward wherever the vulnerability is, because it is systemic). That being said I think that 99% of potential solutions for it are either not going to work or not going to be testable or aren’t going to be the right thing when the crisis hits.
Another way of saying this is that I think it’s a very hard problem and ‘limit size’ seems like a too-easy solution or a solution before thorough study. I write code for a living and I’m well familiar with the syndrome of trying to solve problems too early in the development cycle. I could be convinced of it — but it doesn’t seem ‘obvious’ to me.
Significantly increasing equity capital requirements seems like a no-brainer though, as does having some sort of recapitalization protocol (something like good bank / bad bank — something that hives off bad assets and creates equity from debt) for large instutitions.
A couple points:
First of all, limiting bank size by assets is simply not a viable option. Never has been, never will be. Say you cap bank size at $100bn in assets. What happens when a bank with $99bn in assets fails? The FDIC can’t resolve the failed bank with a Purchase & Assumption transaction (which is how roughly 90% of bank failures are resolved currently), because the acquiring bank would be over the $100bn cap. So now you’re stuck liquidating a bank that, by virtue of the cap on bank size, is one of the largest banks in the US. What’s more, the liquidation process will be significantly hindered because other banks that are close to the $100bn cap can’t participate, since acquiring more assets would put them over the $100bn mark. And on and on it goes.
Second, you have to distinguish between financial crises and normal recessions. Your argument is that the benefits of diversification that a large bank can offer don’t prove to be all that useful in a financial crisis, because all correlations go to 1. True, but not all recessions are financial crises where all the correlations go to 1. The 2001 recession is case in point. In run-of-the-mill recessions, the diversification that large banks can offer will likely prove very beneficial.
(As an aside, I’ve been shocked by how quickly the Street forgot that in financial crises all correlations go to 1. Having lived through the frantic weekend meetings at the NY Fed on the eve of LTCM’s near-failure, I didn’t think it was possible for anyone who was involved in that nightmare to forget how quickly the correlations can go to 1. But forget they did. It was only 10 years ago for god’s sake!)
Chris, I’m on that. My suspicion is that it won’t clear, because there is too much noise in smaller bank (the std on the big banks is surprisingly low). It’s going to be the nature of consolidation and the current MBA wave for mergers and giganticness that there will only be a few at the top.
I don’t think it’s noise in the smaller banks – I think it’s variation in banking practices among smaller banks producing variation in results. Or, at least, it might be.
In that case, there’s no particularly strong reason to believe that big banks will *always* end up at the bad end of the range of small bank practices, just because these particular 4 did in this particular crisis. If we had a larger sample size of large banks, we might see that some are smarter than others, too. At least, these data are too sparse to rule it out.
Thus, there is IMO not enough data to reject the null hypothesis that the performance of big banks is not significantly different from the performance of small banks.